
Investment Intelligence
Built to Maximize Value.
Matthews™ develops custom investment analyses for express wash operators using your operating performance, local market insights, state-specific benchmarks, and institutional underwriting methodologies. Every model is built from your actual P&L data — not a generic template applied to your address.
The result is an investment-grade analysis that strengthens buyer confidence, highlights value-creation opportunities, and maximizes enterprise value ahead of a sale. Sellers enter the market knowing exactly what their numbers say — and how a buyer will read them.
Market Insights
Understand how your business performs within its local market.
Proprietary benchmarking using comparable operators, pricing trends, traffic patterns, demographics, operating expenses, customer capture rates, and regional performance metrics.
Investment-Grade Analysis
Present your business the way institutional buyers underwrite acquisitions.
Custom financial exhibits, operational analyses, and underwriting packages built for valuation discussions, lender review, investment committees, and buyer due diligence.
Enterprise Value Creation
Identify opportunities before going to market.
Quantify pricing opportunities, operational improvements, revenue growth initiatives, and strategic recommendations that strengthen the investment thesis.
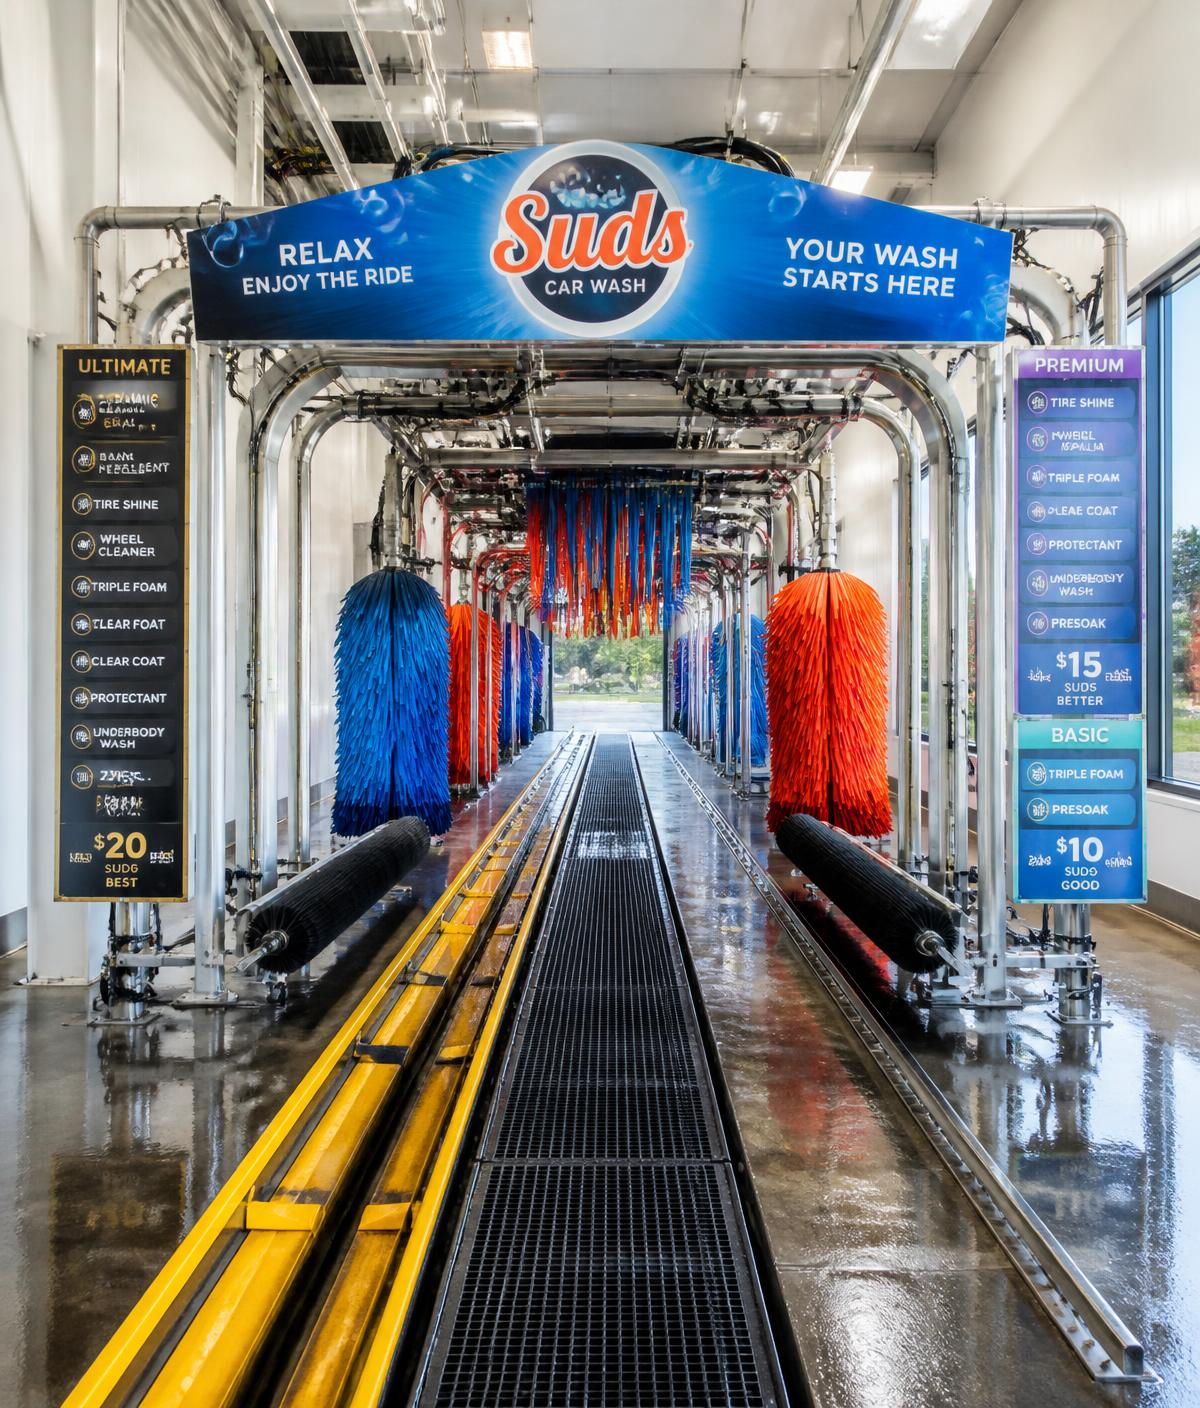
Every seller’s situation tells a different story.
We don’t run the same model for every deal. We assess where a site sits in its lifecycle — ramping, stabilized, impacted, or mature — and select the combination of tools that tells that story credibly to an underwriter.
These models serve two purposes: helping owners see their potential as a seller, and becoming the buyer-facing package used to close the deal.
It starts with a conversation — we’ll look at your numbers and show you what they could say.
01
Situation-First Underwriting
We match the right model to your story. A brand-new site, a road-impacted location, and a mature operator all need completely different analyses.
02
State-Level Benchmarks, Any Market
Expense, seasonality, and car-count data built from real P&L files across markets we actively work, expandable to any US state.
03
Built for Both Sides of the Deal
These models help sellers understand what their site is worth, and become the buyer-facing package used to get the deal sold.
Investment Intelligence
- Financial Underwriting
- Revenue Modeling
- Expense Benchmarking
Buyer Intelligence
- Pricing Analysis
- Market Positioning
- Buyer Case Study
Value Creation
- Operational Improvements
- Five-Year Outlook
- Enterprise Value
What an investment-grade package looks like.
A representative selection of the exhibits delivered in a Matthews™ analysis — revenue modeling, pricing position, traffic conversion, long-range outlook, and customer mix.
All figures shown are illustrative examples and do not reflect verified operator data.
Revenue Projection
Exhibit 01
10.0%
Highest Month
6.8%
Lowest Month
53.0%
Peak Season — % of Annual Revenue
37.8%
Peak 4-Month Span
Monthly revenue — actual vs. forecast ($000s)
Conservative
$2.28M
Projected Revenue
$0.94M
EBITDA
Base Case
$2.48M
Projected Revenue
$1.09M
EBITDA
Optimistic
$2.71M
Projected Revenue
$1.24M
EBITDA
Reach
$2.96M
Projected Revenue
$1.41M
EBITDA
Pricing Opportunity Matrix
Exhibit 02
12
Competitors Surveyed
3-Mile
Market Coverage
$34
Median Unlimited Membership
+$5
Pricing Gap
+$126K
Est. Revenue Opportunity
| Operator | Basic | Deluxe | Premium | Unlimited | Distance | Positioning |
|---|---|---|---|---|---|---|
| Subject Site | $9 | $14 | $19 | $29 | — | Value |
| Shine Express | $10 | $16 | $22 | $34 | 0.8 mi | Market |
| Blue Wave Wash | $12 | $18 | $25 | $39 | 1.4 mi | Premium |
| Rapid Auto Spa | $10 | $15 | $21 | $33 | 2.1 mi | Market |
| Summit Car Care | $11 | $17 | $24 | $36 | 2.7 mi | Premium |
Investment Takeaways
- The subject site prices $5 below the 3-mile median unlimited membership with no measurable service deficit — the discount is unearned.
- A staged $3 then $2 increase over two quarters models to +$126K annual revenue at a 4% assumed churn impact.
- Premium-tier attach rate trails the market by 6 points, indicating menu design rather than demand is the constraint.
Traffic Conversion Analysis
Exhibit 03
24,800
Daily Vehicles (VPD)
3.6%
Capture Rate
26,700
Monthly Captured Vehicles
$9.40
Revenue per Customer
Capture rate trend — trailing 12 months (%)
| Scenario | Capture Rate | Monthly Vehicles | Annual Revenue | Enterprise Value |
|---|---|---|---|---|
| Current | 3.6% | 26,700 | $2.48M | $8.7M |
| +25 bps | 3.85% | 28,600 | $2.63M | $9.4M |
| +50 bps | 4.10% | 30,400 | $2.79M | $10.1M |
| +100 bps | 4.60% | 34,100 | $3.09M | $11.5M |
Five-Year Revenue & EBITDA Outlook
Exhibit 04
Projected revenue by scenario ($M)
| Metric | Yr 1 | Yr 2 | Yr 3 | Yr 4 | Yr 5 | 5-Yr CAGR |
|---|---|---|---|---|---|---|
| Revenue | $2.48M | $2.62M | $2.77M | $2.93M | $3.10M | 5.7% |
| EBITDA | $1.09M | $1.18M | $1.27M | $1.37M | $1.47M | 7.8% |
| EBITDA Margin | 44.0% | 45.0% | 45.8% | 46.6% | 47.4% | — |
Membership & Customer Mix
Exhibit 05
1,940
Active Members
58%
Membership Penetration
$31.20
Avg Revenue / Member
2.7
Avg Monthly Visits
Revenue mix by category
- Unlimited Memberships58%
- Retail Washes29%
- Add-Ons & Detail9%
- Vending & Other4%
Subject vs. market median
| Benchmark | Subject | Market Median | Variance |
|---|---|---|---|
| Membership penetration | 58% | 51% | +7 pts |
| Avg revenue / member | $31.20 | $33.80 | -$2.60 |
| Monthly visits / member | 2.7 | 2.4 | +0.3 |
| Member churn | 5.1% | 6.0% | -0.9 pts |
Assumptions & underwriting inputs.
Every exhibit traces back to a documented input. Buyers and lenders can follow the logic from raw operating data to enterprise value.
4
Input Categories
60+
Variables Reviewed
9
Data Sources
3-Tier
Confidence Framework
Financial Inputs
- Trailing 12 P&L
- Revenue by channel
- Labor & payroll load
- Chemical cost per car
- Owner add-backs
Operating Inputs
- Car counts by month
- Membership churn
- Retail vs. member mix
- Throughput per hour
- Staffing model
Market Inputs
- Competitor pricing
- 3-mile demographics
- Traffic counts (VPD)
- Household income
- Planned development
Site & Real Estate Inputs
- Land & building basis
- Lease or fee structure
- Tunnel length & equipment
- Vacuum stall count
- Access & visibility
01
Underwriting Inputs
02
Revenue Projection
03
Expense Benchmarking
04
Pricing Analysis
05
Value Creation
06
Buyer Positioning
For more information,
please contact a Matthews™ specialized agent.

Simon Assaf
Senior Vice President & Director